Plots for the comparison of the original data and perturbed data.
plotMicro(x, p, which.plot = 1:3)Arguments
- x
an output object of
microaggregation()- p
necessary parameter for the box cox transformation (
lambda)- which.plot
which plot should be created?
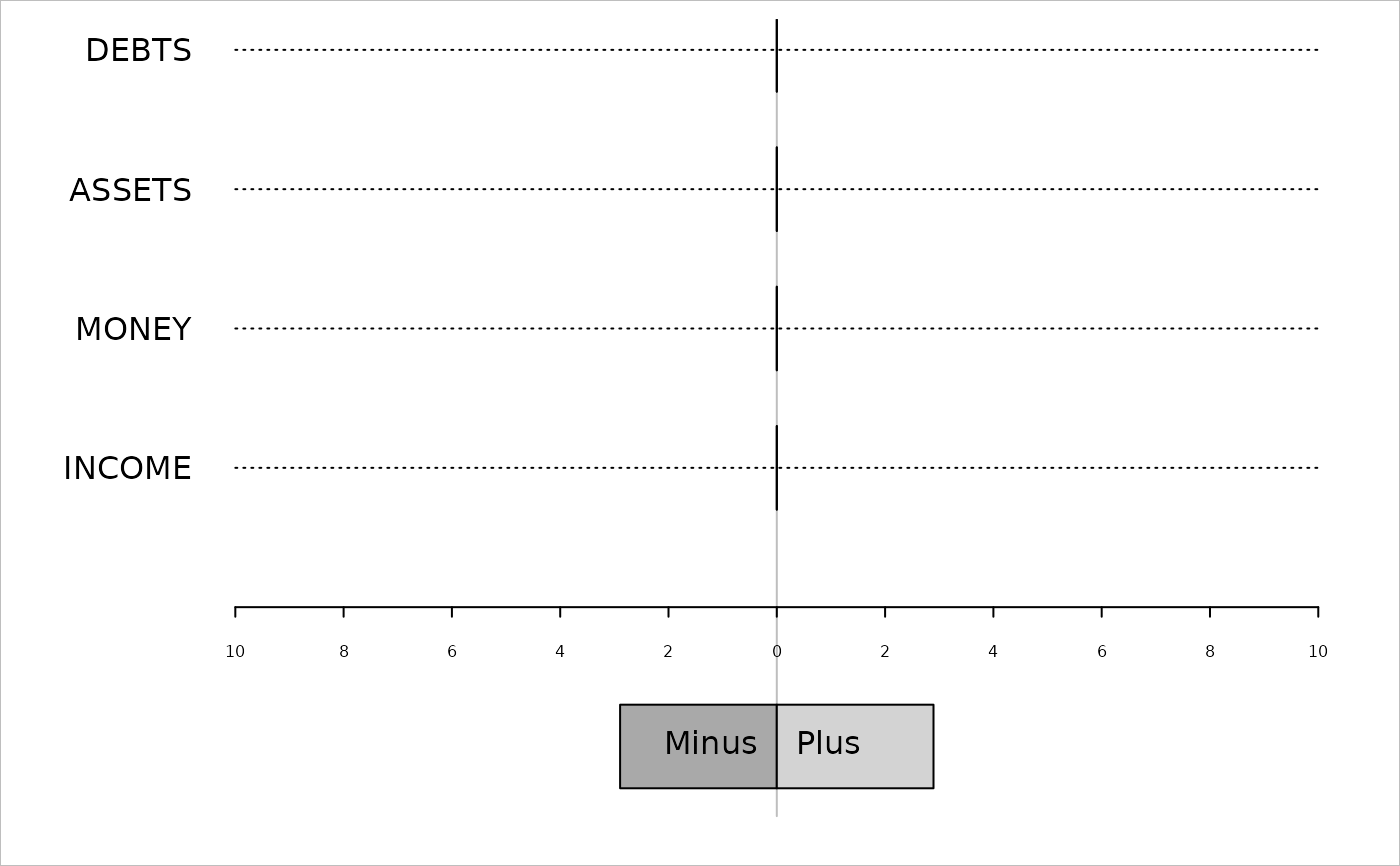
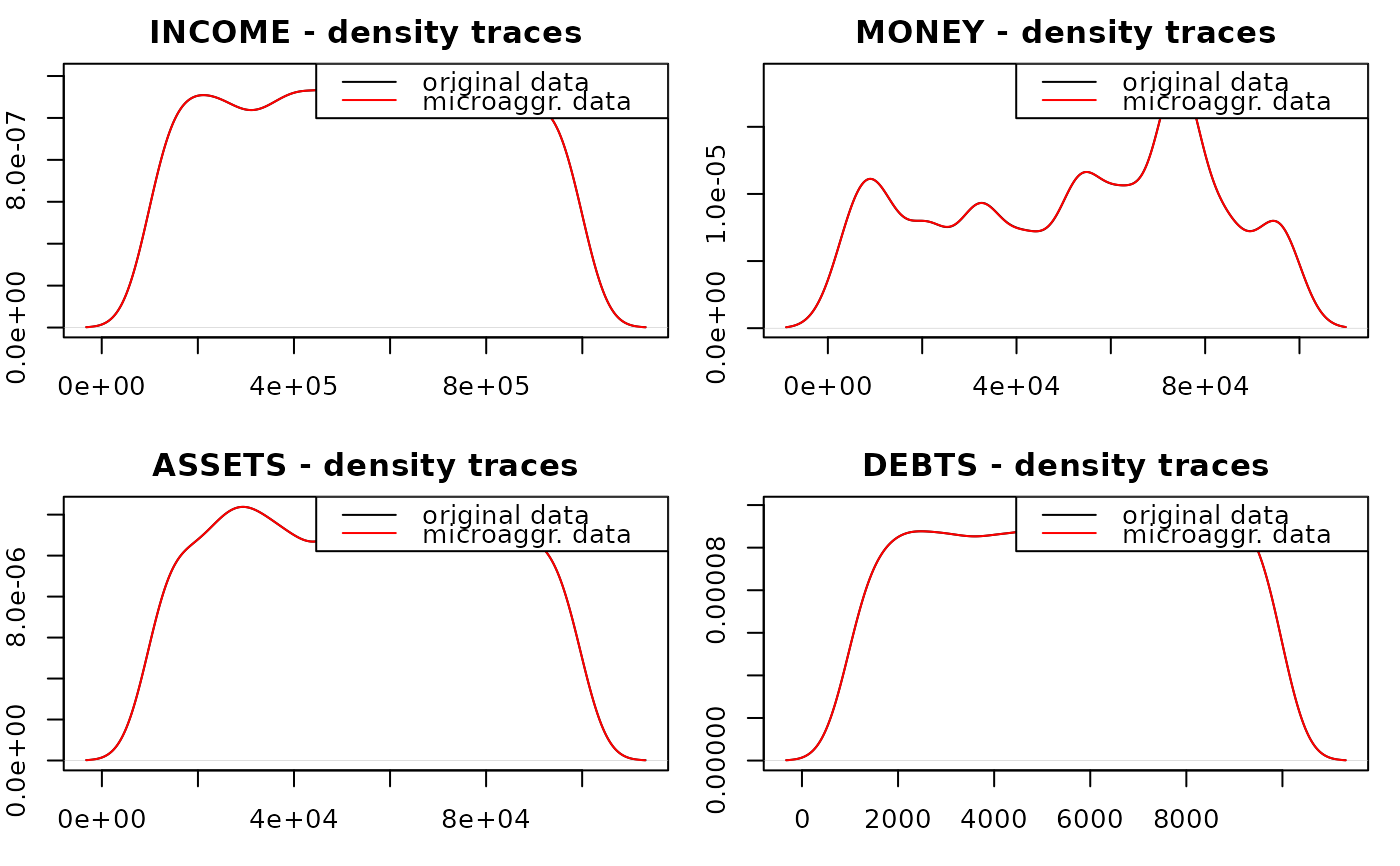
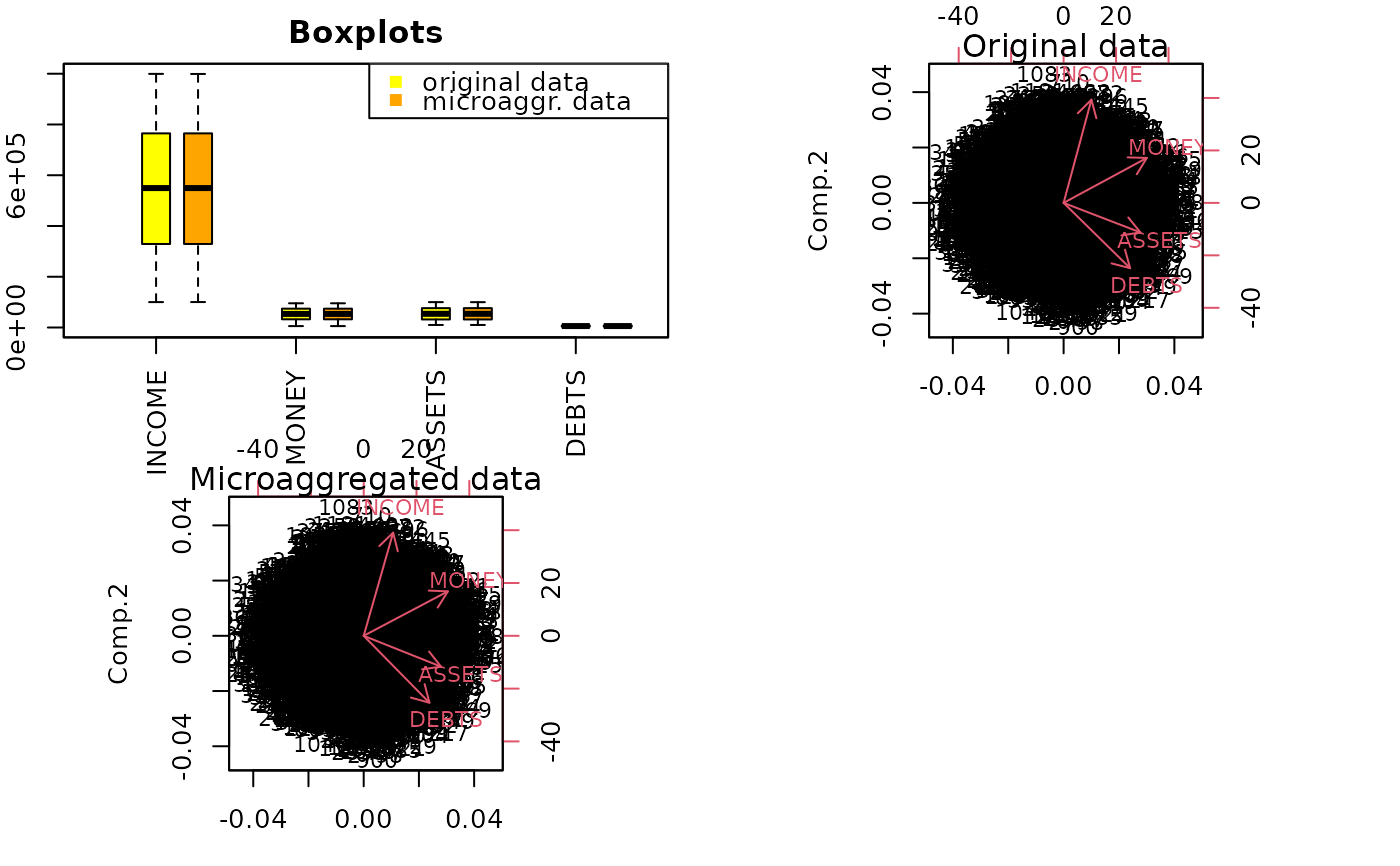
1: density traces2: parallel boxplots3: differences in totals
Value
returns NULL; the selected plot is displayed
Details
Univariate and multivariate comparison plots are implemented to detect differences between the perturbed and the original data, but also to compare perturbed data which are produced by different methods.
References
Templ, M. and Meindl, B., Software Development for SDC in R, Lecture Notes in Computer Science, Privacy in Statistical Databases, vol. 4302, pp. 347-359, 2006.
See also
Examples
data(free1)
df <- as.data.frame(free1)[, 31:34]
m1 <- microaggregation(df, method = "onedims", aggr = 3)
plotMicro(m1, p = 1, which.plot = 1)

plotMicro(m1, p = 1, which.plot = 2)

plotMicro(m1, p = 1, which.plot = 3)