Descriptive plot function for sdcMicroObj-objects. Currently only visualization of local supression is implemented.
# S3 method for class 'sdcMicroObj'
plot(x, type = "ls", ...)
Arguments
- x
An object of class sdcMicroObj
- type
specified what kind of plot will be generated
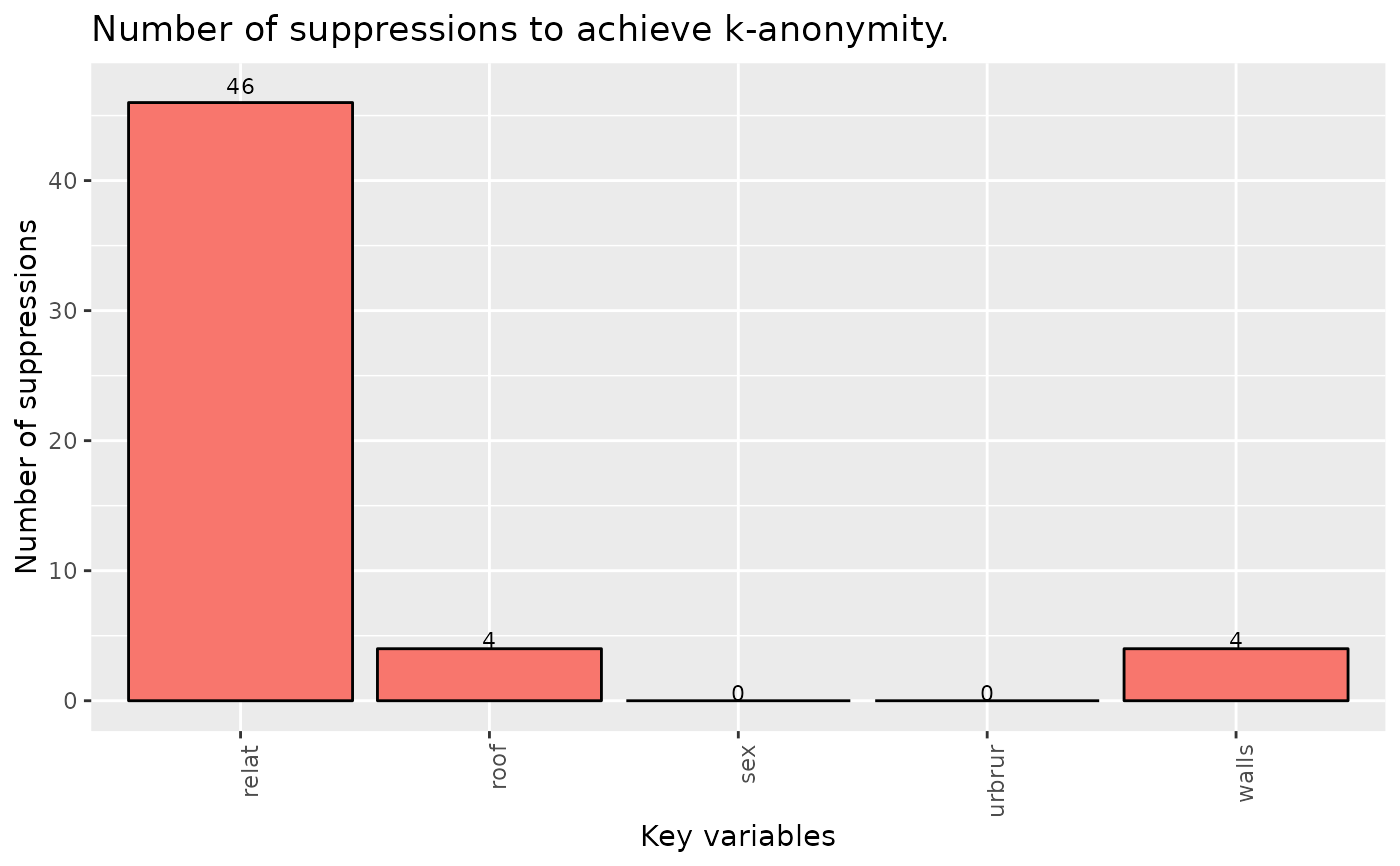
"ls": plot of local suppressions in key variables
- ...
currently ignored
Value
a ggplot plot object or (invisible) NULL if local suppression
using kAnon() has not been applied
Examples
# \donttest{
data(testdata)
sdc <- createSdcObj(testdata,
  keyVars = c("urbrur", "roof", "walls", "relat", "sex"),
  w = "sampling_weight")
sdc <- kAnon(sdc, k = 3)
plot(sdc, type = "ls")

# }
# }